Filter Flow Analysis
Filter Flow: Theoretical Foundations
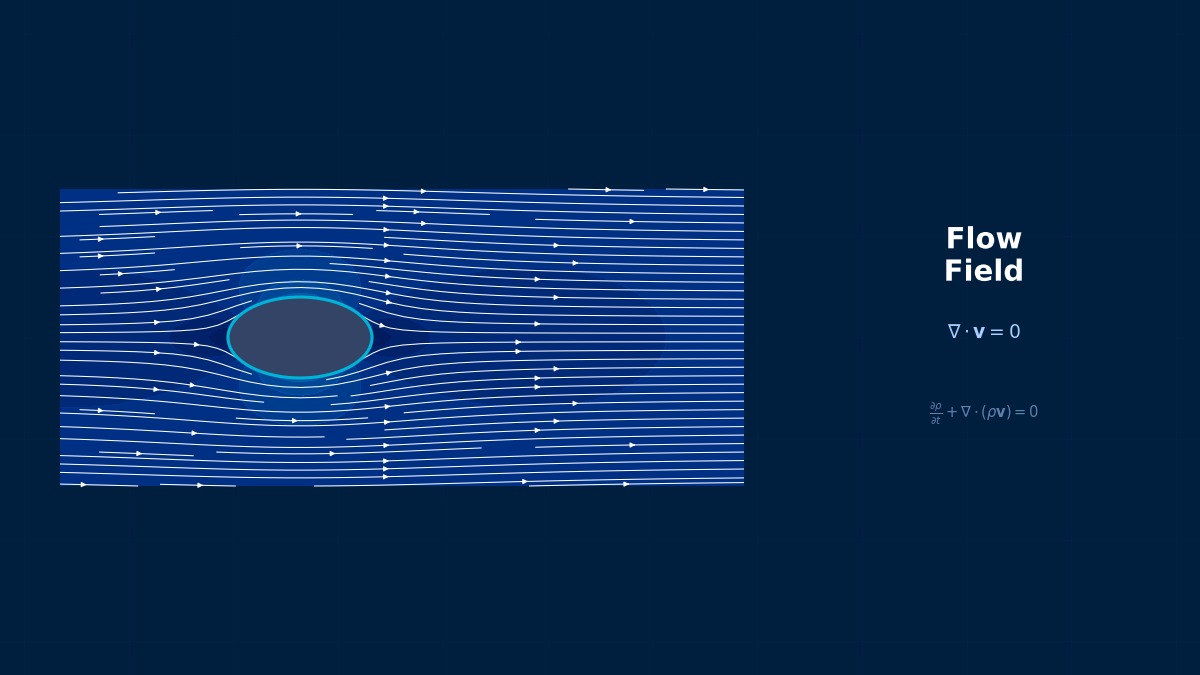
Overview
Teacher! In what situations is CFD analysis of flow inside filters used?
It's used for predicting pressure loss and evaluating particle collection efficiency for flows passing through porous media, such as air filters, oil filters, DPF (Diesel Particulate Filter) for exhaust gas catalysts, water purification filters, etc.
Governing Equations
Filters are porous, right? Do you use the Navier-Stokes equations as-is?
There are two approaches: directly resolving the filter pores (Pore-Scale Simulation) and using a volume-averaged porous media model. In practice, the latter is used almost exclusively.
In the porous media model, flow resistance is expressed by the Darcy-Forchheimer equation.
The first term is Darcy's viscous resistance, and the second term is Forchheimer's inertial resistance, right?
Exactly. $\alpha$ [m²] is the permeability, and $C_2$ [1/m] is the inertial resistance coefficient. For low-speed flow (Re < 1), the Darcy term dominates, while for high-speed flow, the inertial term becomes important.
For packed beds, the Ergun equation is used.
$\phi$ is the porosity and $d_p$ is the packed particle diameter, right? What is the relationship between the Ergun equation and Darcy-Forchheimer?
Porous parameters can be back-calculated from the Ergun equation.
Modeling Particle Collection
How is the particle collection efficiency of a filter modeled?
The basic theory is Single Fiber Theory. The efficiencies of various collection mechanisms for a single fiber are summed.
| Collection Mechanism | Dominant Particle Size | Efficiency Formula (Outline) |
|---|---|---|
| Interception | > 0.5 um | $E_R = \frac{R^2}{(1+R) Ku}$ |
| Impaction | > 1 um | $E_I \propto Stk^2$ |
| Brownian Diffusion | < 0.3 um | $E_D \propto Pe^{-2/3}$ |
| Gravitational Settling | > 5 um | $E_G = G/(Ku \cdot Re_f)$ |
| Electrostatic | All sizes | Depends on charge amount |
The MPPS (Most Penetrating Particle Size) is around 0.1~0.3 um because of the gap between diffusion and inertia, right?
Exactly. That's why the collection efficiency curve for HEPA filters is V-shaped. In CFD, methods using DPM to track particle trajectories and determine arrival at the fiber layer are used.
Practical Considerations
What should be especially careful about in filter CFD?
- Porous parameters ($\alpha$, $C_2$) should be fitted from the filter manufacturer's pressure loss data.
- Since actual filter pressure loss characteristics are nonlinear, it is desirable to obtain data at multiple face velocities.
- Pressure loss increase due to filter clogging (dust accumulation) is a time-varying problem, so introducing temporal changes via UDFs, etc., may be necessary.
The "Three Mechanisms" of Filter Collection — Caught Whether Too Big or Too Small
An interesting point in filter flow theory is how the particle collection mechanism switches depending on particle size. Large particles (several μm and above) are caught by "inertial impaction" — deviating from streamlines and colliding with fibers. Mid-sized particles (0.5~2μm) are caught by "interception" — contacting fibers while following streamlines. Ultrafine particles (below 0.1μm) are caught by "diffusion collection" — moving zigzag due to Brownian motion and accidentally adhering to fibers. This means the hardest particles to collect are those in the transitional zone of 0.1~0.3μm, which have "weak inertia and weak Brownian motion." The Single Fiber Theory, which combines these three mechanisms, forms the theoretical basis for filter design.
Computational Methods for Filter Flow
Details of Numerical Methods
Please teach me the specific implementation methods for filter CFD.
There are two implementation methods for the porous media model: Volumetric Porous Zone (distributing resistance over the entire volume) and Porous Jump (setting a pressure jump on a thin surface).
Porous Zone vs. Porous Jump
| Method | Application | Advantages | Disadvantages |
|---|---|---|---|
| Porous Zone | Thick filters (packed beds, catalyst layers) | Obtains velocity distribution inside the filter | Requires mesh |
| Porous Jump | Thin filters (pleated filters) | No mesh needed, computationally light | No internal flow information |
So thin filters like HEPA filters can be handled with Porous Jump, right?
Yes. If the filter thickness is on the order of a few cm and detailed flow in the thickness direction is unnecessary, Porous Jump is efficient. For cases like DPF where thickness is 100mm or more, use Porous Zone.
Procedure for Setting Up Porous Media in Fluent
Please teach me the specific steps to set up a Porous Zone in Fluent.
1. Select the filter region in Cell Zone and enable Porous Zone.
2. Set Direction-1 Vector to the filter normal direction.
3. Input Viscous Resistance (1/α [1/m²]) and Inertial Resistance (C₂ [1/m]).
4. Input Porosity (default 1.0 means the entire space is flow path; change to the physical porosity).
Here's an example calculation of resistance values. For a HEPA filter with face velocity 0.5 m/s, pressure loss 250 Pa, and thickness 65 mm.
Assuming the Darcy term dominates in the low-speed region.
So Viscous Resistance is about 4.3e8. Is Inertial Resistance determined from data at another face velocity?
Yes. If you have pressure loss data at two or more face velocities, you can separate the Darcy and Forchheimer terms using simultaneous equations. Use data like pressure loss 140 Pa at face velocity 0.3 m/s and 380 Pa at 0.7 m/s.
Coupling with DPM
How is particle collection in filters modeled with DPM?
There is a method where the wall condition for DPM particles inside a Porous Zone is set to Trap, treating collisions with the filter fiber surface as collection. However, this is a simplified model; for more accuracy, the collection probability is implemented as a function of particle size via a UDF.
The overall collection efficiency of a filter is expressed by the following equation.
$\alpha_f$ is the filter packing fraction, $E_f$ is the single fiber efficiency, and $d_f$ is the fiber diameter, right?
Yes. In CFD, the local single fiber efficiency is calculated from the local face velocity in each cell and applied as the collection probability for DPM particles.
Mesh Considerations
What about the mesh for the filter region?
- Porous Zone: Ensure at least 5~10 cell layers in the filter thickness direction.
- Provide sufficient space upstream and downstream of the filter (each 3~5 times the filter thickness).
- For pleated filters, simplify the pleat shape or calculate using a periodic model of one pleat.
Pleated filters have complex pleat shapes, but do you model them all?
Modeling all pleats in 3D is often not realistic. A practical approach is to determine representative characteristics using a periodic boundary model of 1~3 pleats and treat the entire model as an equivalent porous surface.
Inside the "Porous Media Model" for Modeling Filters in CFD
The "Porous Media Model" often used in filter flow analysis is a method that ignores the detailed fiber structure inside the filter layer and treats it as a pressure loss source distributed over the entire volume. Both Fluent and OpenFOAM have implementations based on Darcy's law, where pressure loss coefficients (viscous resistance coefficient $\alpha$ and inertial resistance coefficient $C_2$) are fitted from measured ΔP-velocity curves. A point of caution is that it ignores "the actual non-uniformity in the filter thickness direction" — when clogging progresses locally in actual use, the model's accuracy decreases. Therefore, for analysis including temporal degradation, it's necessary to couple it with particle tracking (DPM).
Experience the theory firsthand with the interactive simulator for this field
All Simulators