Investment Casting Simulation
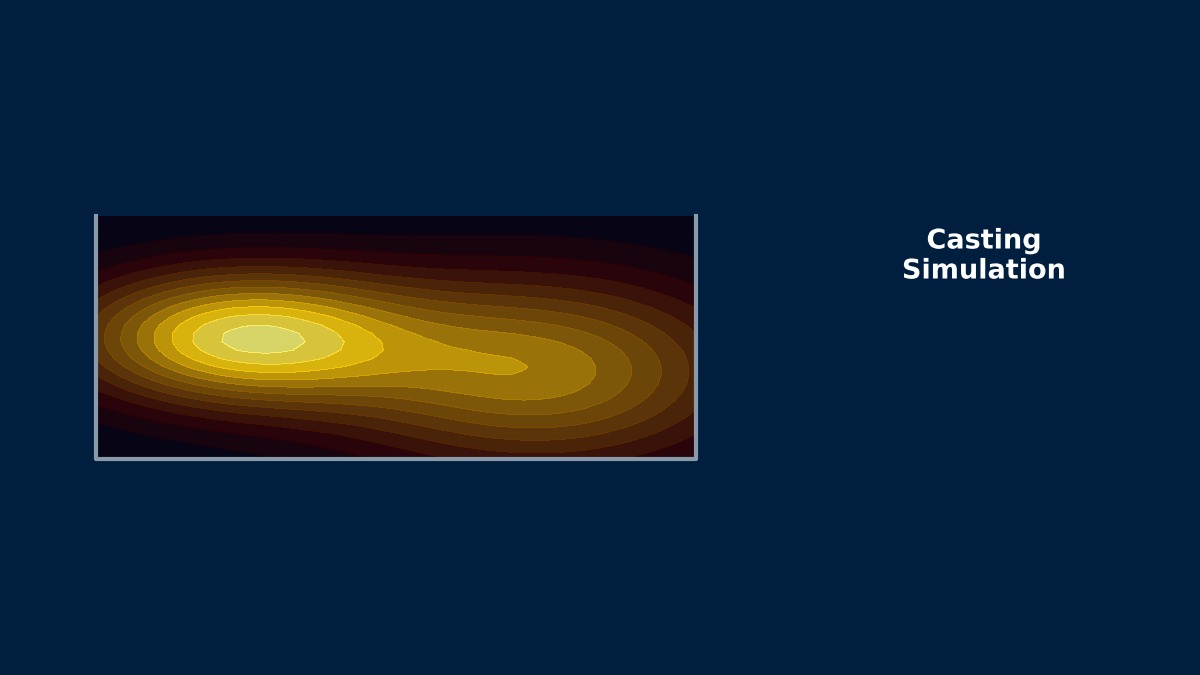
Theory: designing the order of solidification
Overview
How does analysing investment casting differ from ordinary sand casting?
The mould. In investment casting a wax pattern is dipped repeatedly in ceramic slurry and sand to build a shell, the wax is melted out, and the shell is fired. Shells are thin — a few mm up to about 10 mm — and are often preheated to several hundred to over a thousand degrees right up to pouring. Metal therefore stays hot and fills thin sections, but solidifies slowly, and geometry largely decides where it freezes last. In analysis, the shell's thermal properties and thickness, the preheat temperature and radiation from the shell exterior after it leaves the furnace drive results even more than in sand casting. For single-crystal or directionally solidified parts such as turbine blades, the withdrawal rate from the furnace is controlled to set the temperature gradient.
Chvorinov's rule and feeders
t_s is solidification time, V volume, A the cooling surface area, M the modulus and B a constant set by mould and alloy. A riser (the part that feeds liquid) must freeze later than the casting, so its modulus should be at least 1.2 times larger.
Shrinkage allowance
s_w is the linear shrinkage of the wax and s_m that of the alloy; the wax die is enlarged for both.
A 5,000-year-old process
Shaping in wax, encasing in clay, firing, melting out the wax and pouring metal already appears in bronze objects from Mesopotamia and the Indus civilisation around 3000 BC. In the 20th century it was used for dental gold crowns, and in the Second World War it was rapidly industrialised to mass-produce jet engine turbine blades. Today's single-crystal turbine blades combine this ancient process with solidification control and simulation.
Worked examples
Example 1: thin wall vs block solidification time, and riser size
| Region | Modulus | Solidification time (vs thin wall) | Riser needed (H = 1.5D) |
|---|---|---|---|
| 3 mm thin wall | 1.50 mm | 1 | — |
| 20 × 20 × 30 mm block (all faces cooling) | 3.75 mm | 6.25 | ≥ 24 mm diameter |
| Same, one 20 × 30 mm face joined to the wall | 4.62 mm | 9.5 | ≥ 29.5 mm diameter |
No heat escapes through the joined face, so the block's modulus rises from 3.75 mm to 4.62 mm and its solidification time grows another 1.5-fold. If a thick region is isolated behind a thin one, feeding is cut off and shrinkage porosity forms.
The riser size came out of a calculation. Is simulation still worth doing?
Yes. The modulus calculation assumes each region cools independently, but in a real part thin walls and blocks exchange heat, shell thickness varies by location, and radiation between neighbouring parts on the tree keeps some faces hot. Simulation tracks solid fraction over time and checks for isolated liquid regions surrounded by solid (hot spots), and criteria such as Niyama — based on temperature gradient and cooling rate — rate the risk of fine shrinkage porosity. Use hand calculation to set the initial riser size and position, and simulation to confirm that design actually feeds.
Example 2: wax die dimensions
| Part dimension | Wax shrinkage | Alloy shrinkage | Die dimension |
|---|---|---|---|
| 100 mm | 1.0% | 2.0% | 103.07 mm |
Shrinkage values are assumed. Simply adding the two gives 103.00 mm, 0.07 mm off; with investment casting tolerances sometimes in the ±0.1 mm range, multiply rather than add. Actual shrinkage is smaller where the shell or cores restrain the part, so correction factors are usually kept per direction.
Practical workflow
- Model the part and tree (runners and risers) and size initial risers with the modulus.
- Set shell thickness, thermal properties and preheat, pouring temperature and pouring time.
- Check misruns and entrainment with filling analysis.
- Inspect isolated liquid and Niyama values in the solidification analysis; revise risers and runners.
- Compare with X-ray and sectioned trial castings; tune shell and interface heat transfer.
“The 30 seconds from furnace to pour”
In the tens of seconds between taking a preheated shell out of the furnace and pouring, the thin shell's exterior cools rapidly by radiation. If the analysis holds the shell uniformly at preheat temperature, it may show no misrun at thin tips while the foundry sees one. Simply including cooling from the moment the shell leaves the furnace often brings predicted misrun locations in line with trials.
Common mistakes
Mistakes and fixes
| Mistake | Effect | Fix |
|---|---|---|
| Shell at uniform preheat | Misruns missed | Include radiative cooling after leaving the furnace |
| Modelling a single part, not the tree | Radiation between parts ignored | Analyse the whole tree |
| Adding shrinkage percentages | Dimensional error | Multiply and correct per direction |
| Risers sized by modulus alone | Isolated liquid missed | Confirm with solidification analysis |
| Constant interface heat transfer | Solidification time error | Account for gap formation |
I'd like to learn related topics.
Related pages include casting solidification analysis, casting filling analysis, casting defect prediction and casting residual stress analysis.
Related Topics
Experience the theory firsthand with the interactive simulator for this field
All Simulators