Transient Conduction with Internal Heat Generation
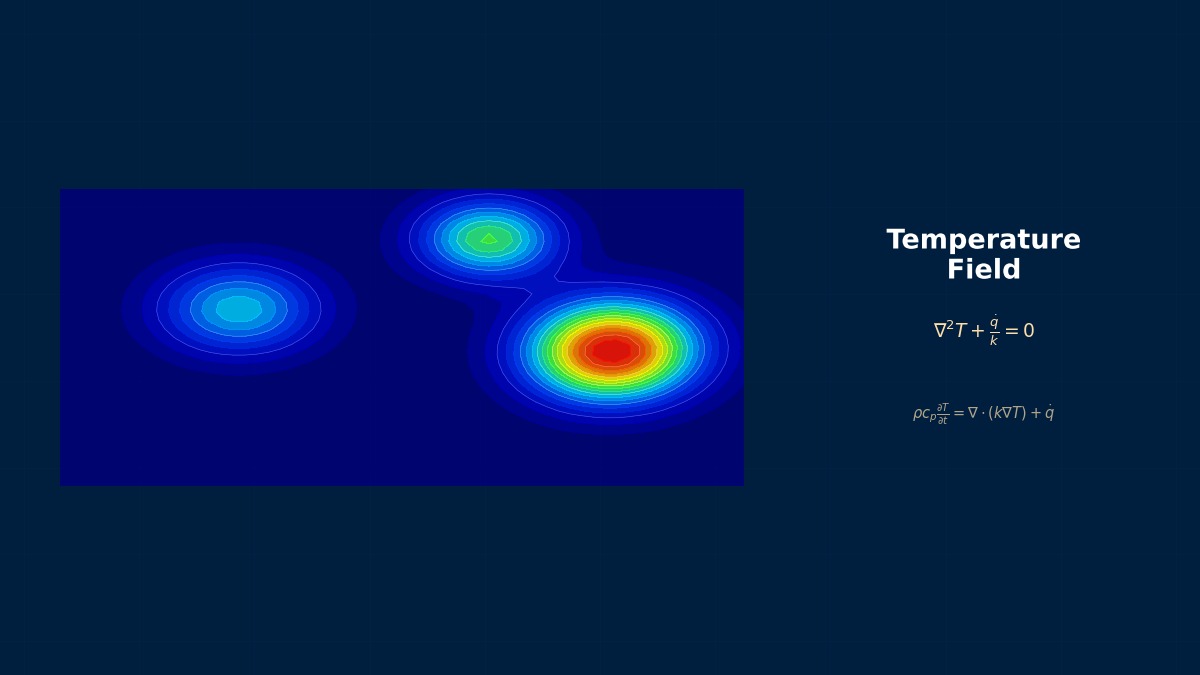
Theory: until generation balances loss
Overview
For parts that heat internally, is the final temperature all I need?
Often not. Reaching the final (steady) temperature takes time, and if the load stops first, steady is never reached. Conversely, when generation decays over time, as in concrete, the peak comes part-way through. And how the surface cools (Biot number) changes both the steady temperature and the time greatly. Let's calculate how fast a plane wall approaches steady state and the peak temperature of thick concrete heated by hydration.
Governing equation and steady solution
$L$ is half-thickness and $h$ the surface heat transfer coefficient; fixed surface temperature corresponds to $Bi \to \infty$. The smaller the Biot number, the more the surface itself warms, raising the steady centre temperature.
Series solution for fixed surface temperature
Cooling dam concrete
In the 1930s, building Hoover Dam in the US, hydration heat in the vast concrete was a major problem: left alone it was estimated to take over a century to cool, cracking as it shrank. So steel cooling pipes carrying cold water were embedded to extract heat, and the dam was cast in blocks. It's an example of generation-and-conduction calculations determining how a giant structure was built. Mass concrete today still prevents thermal cracking the same way.
Worked examples
Example 1: approach to steady state (fixed surface)
| Fraction of steady | Fourier number | Half-thickness 0.2 m, α 7×10⁻⁷ m²/s |
|---|---|---|
| 50% | 0.294 | 4.7 h |
| 90% | 0.946 | 15.0 h |
| 99% | 1.879 | 29.8 h |
A finite-difference solution (200 cells) reached 90% at Fo = 0.947, matching the series.
Example 2: effect of surface cooling
| Biot number | Steady centre rise (× fixed-surface value) | Fo to reach 90% |
|---|---|---|
| ∞ (fixed surface) | 1.0 | 0.95 |
| 10 | 1.2 | 1.14 |
| 1 | 3.0 | 3.12 |
| 0.1 | 21 | 23.8 |
Example 3: hydration heat in mass concrete
Adiabatic rise 40 K, heat release decaying exponentially with a one-day time constant, diffusivity 1.0×10⁻⁶ m²/s, both faces held at the placing temperature.
| Thickness | Peak centre rise | Time of peak |
|---|---|---|
| 0.5 m | 8.6 K | 0.5 days |
| 1 m | 19.4 K | 1.1 days |
| 2 m | 31.6 K | 2.2 days |
| 4 m | 38.5 K | 4.1 days |
At 4 m thickness it's almost the full adiabatic 40 K.
Time for heat to escape to the surface scales as half-thickness squared over diffusivity: about 46 days at 4 m. Heat release ends within days, so little heat escapes meanwhile and the concrete warms almost adiabatically. At 0.5 m the same time is about 0.7 days, so heat escapes alongside generation and the rise is only 8.6 K. In thick members the centre rises nearly 40 K while the surface is cooled by the air, and the interior–surface difference puts the surface in tension and makes it crack-prone. Hence cooling pipes, low-heat cement or casting in lifts.
Analysis tips
- First gauge the time scale L²/α and compare it with the load duration.
- Think of surface conditions via the Biot number; small Biot changes both steady temperature and time greatly.
- If generation varies with time or temperature, include that function (hydration, battery heat, etc.).
- Evaluate both peak temperature and interior–surface difference.
- Verify the code on problems with analytical solutions before solving real geometry.
“Brief overloads are fine”
Cables and motor windings can often carry more than rated current briefly without burning, because temperature takes time to approach steady state even as heating rises. Cable short-time ratings are set precisely by this transient calculation. Conversely, where cooling is weak (low Biot), the steady temperature is higher and also slower to reach, so short tests misjudge the final temperature. Temperature tests should run several time constants or more.
Common mistakes
Mistakes and fixes
| Mistake | Effect | Fix |
|---|---|---|
| Steady state only | Short loads overrated | Solve transiently |
| Short test | Final temperature underestimated | Several time constants |
| Assuming fixed surface temperature | Temperatures too low | Check Biot number |
| Constant generation | Wrong peak | Include time variation |
| Ignoring interior–surface ΔT | Cracking missed | Evaluate thermal stress |
I'd like to learn related topics.
Try the transient conduction tool. Related pages include lumped capacitance, Heisler charts, periodic heating and semi-infinite solids.
Related Topics
Experience the theory firsthand with the interactive simulator for this field
All Simulators