Thermal Ratcheting Analysis
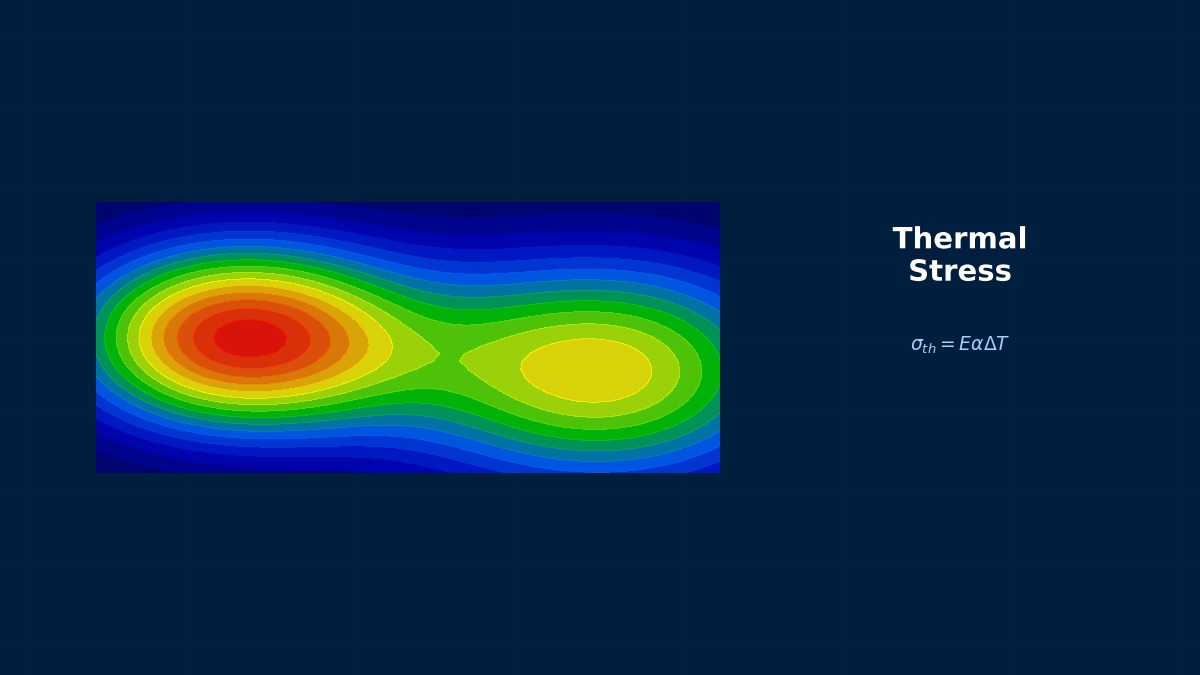
Theory: deformation that creeps forward cycle by cycle
Overview
A pipe that starts up and shuts down repeatedly has slowly grown in diameter. I'd heard the stresses were below yield…
That may well be thermal ratcheting. When stress that is always present — primary stress such as from pressure — is repeatedly overlaid with thermal (secondary) stress, plastic strain can accumulate a little in the same direction each cycle. Secondary stress relaxes as the part deforms, so on its own it doesn't cause failure, but combined with primary stress the deformation advances in one direction only, like a ratchet.
The Bree diagram
$\sigma_p$ is the primary stress (for example the hoop membrane stress from pressure), $\Delta\sigma_t$ the elastically calculated range of thermal stress from the through-wall temperature difference, and $\sigma_y$ the yield stress. Bree presented the diagram for thin cylinders in 1967; the behaviour depends on the combination of X and Y.
| Region | Approximate condition | Behaviour |
|---|---|---|
| Elastic | X + Y ≤ 1 | Always elastic |
| Shakedown | Y ≤ 2 and below the ratchet boundary | Yields in the first few cycles, then elastic |
| Alternating plasticity | Y > 2 and below the ratchet boundary | Yields back and forth every cycle without net growth; low-cycle fatigue is the concern |
| Ratcheting | Above the ratchet boundary | Plastic strain accumulates in one direction every cycle |
This ratchet boundary is also used in the thermal-stress ratchet rule of the ASME Boiler and Pressure Vessel Code.
A diagram born from reactor fuel cladding
The Bree diagram was derived by the British nuclear researcher Bree with the cladding tubes of fast-reactor fuel rods in mind. The cladding carries fission-gas pressure from inside, and the through-wall temperature difference changes greatly each time power rises and falls — a classic combination of primary stress and cyclic thermal stress, where it was vital to know how much deformation is acceptable. Derived in closed form from a simple elastic–perfectly-plastic model, the result still underpins pressure-equipment design codes more than half a century later.
Worked example: checking the boundary numerically
Elastic–perfectly-plastic fibre model
The wall was divided into 201 fibres with uniform total strain (no bending) and elastic–perfectly-plastic behaviour. Holding a constant primary stress X, a linear through-wall temperature distribution was applied and removed for 40 cycles, and the increment of total strain in the last cycle (relative to yield strain) was recorded.
| X | Y | ASME boundary | Strain increment per cycle | Result |
|---|---|---|---|---|
| 0.3 | 1.0 | 3.33 | 0 | No ratchet |
| 0.3 | 3.0 | 3.33 | 0 | No ratchet (alternating plasticity) |
| 0.3 | 3.6 | 3.33 | 0.171 | Ratchet |
| 0.6 | 1.4 | 1.60 | 0 | No ratchet |
| 0.6 | 1.8 | 1.60 | 0.215 | Ratchet |
| 0.8 | 0.7 | 0.80 | 0 | No ratchet |
| 0.8 | 0.9 | 0.80 | 0.108 | Ratchet |
At every primary-stress level, crossing the boundary just slightly starts strain accumulating each cycle.
Right: inside the boundary strain stops growing however many cycles you run; outside, it grows by the same amount every cycle. Small per cycle, it becomes large deformation over thousands of start-ups. Also note that the allowable thermal stress range shrinks rapidly as primary stress rises. A design change that eats into the pressure margin can push the component into ratcheting even with unchanged thermal conditions.
Allowable through-wall temperature difference
For steel ($E = 200$ GPa, $\alpha = 12\times10^{-6}$ 1/K, $\nu = 0.3$), each kelvin of through-wall difference gives about 1.7 MPa of thermal stress range. With a yield stress of 200 MPa, the allowable difference from the ratchet boundary is:
| Primary ratio X | Allowable thermal stress range | Allowable temperature difference |
|---|---|---|
| 0.3 | 667 MPa | 389 K |
| 0.6 | 320 MPa | 187 K |
| 0.8 | 160 MPa | 93 K |
Where Y exceeds 2, as at X = 0.3, ratcheting does not occur but the wall yields back and forth every cycle, so low-cycle fatigue must be assessed separately. Code assessments use the code allowable stresses rather than yield and account for temperature-dependent properties.
Assessment with FEM
Procedure
- Solve the start-up, operation and shut-down transients thermally and obtain temperature histories including the moment of maximum through-wall difference.
- In the structural analysis, repeat pressure plus the temperature history as one cycle for several cycles with an elastic-plastic material.
- List the plastic strain (equivalent or hoop) at the end of each cycle and check whether the increment dies out or continues at a constant value.
- Near the boundary, vary load or temperature difference slightly to find the margin.
Choosing the material model
- Avoid isotropic hardening: the yield stress keeps rising under cycling, which tends to hide ratcheting.
- Elastic–perfectly-plastic or linear kinematic hardening: EPP matches the code approach; kinematic hardening is closer to real behaviour.
- Nonlinear kinematic hardening: to predict realistic ratchet rates, use Chaboche-type models identified from cyclic test data.
- Creep at high temperature: in the creep range, stress relaxation and creep strain during hold periods can enhance ratcheting (see creep–fatigue interaction).
“Solving one cycle and calling it safe” is risky
Solving a single elastic-plastic thermal cycle tells you nothing about whether the strain from the first yielding repeats in later cycles or stops. A small first-cycle strain is ratcheting if it accumulates every time; a large one is benign shakedown if later cycles are elastic. The decision rests on how strain grows, not on the size of one cycle, so make it a habit to run at least several cycles and plot the increments.
Common mistakes
Mistakes and fixes
| Mistake | Effect | Fix |
|---|---|---|
| Solving one cycle only | Can't tell ratcheting from shakedown | Run several cycles and check increments |
| Using isotropic hardening | Ratcheting hidden | Use EPP or kinematic hardening |
| Treating thermal stress as primary | Over-conservative design | Classify primary and secondary separately |
| Missing the time of maximum temperature difference | Thermal stress range underestimated | Check all times in the transient thermal analysis |
| Ignoring alternating plasticity | Low-cycle fatigue cracking | Add fatigue assessment when Y > 2 |
I'd like to try the thermal stress and pressure calculations.
Use the thermal stress calculator for temperature difference versus thermal stress, the pressure vessel calculator for pressure membrane stress, and the thermal fatigue simulator for cyclic effects. Related phenomena are covered in thermal cycling, thermo-mechanical fatigue (TMF) and creep–fatigue interaction.