CFD Mesh Quality Metrics
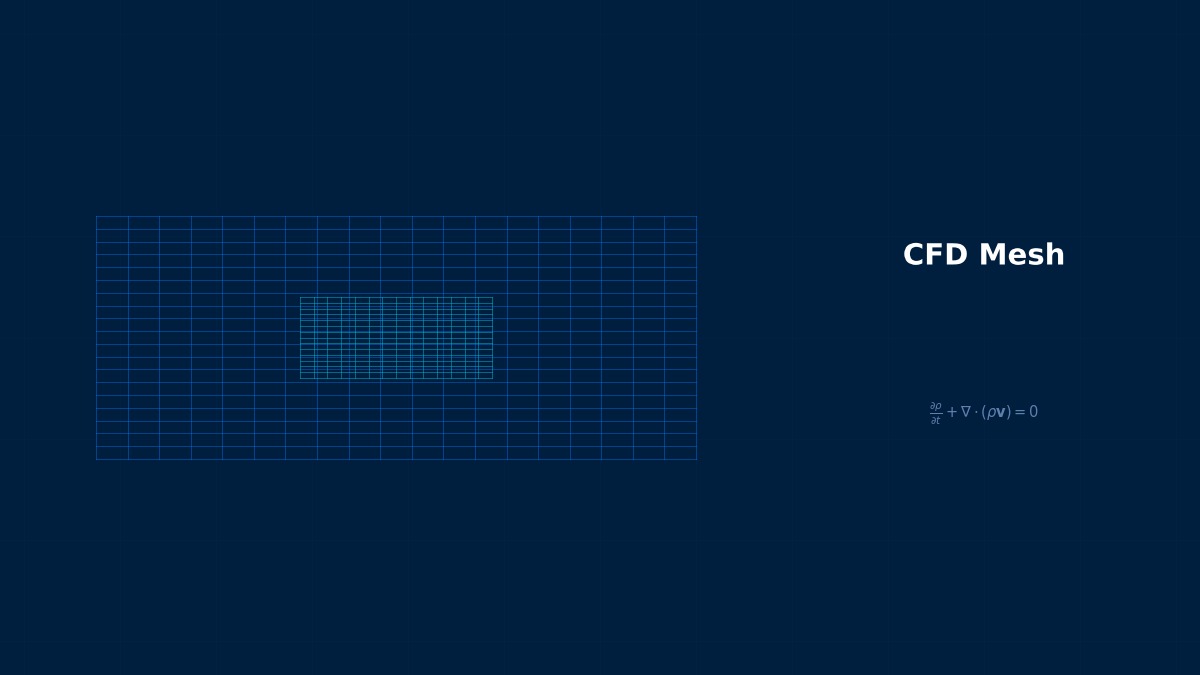
Theory: how quality metrics relate to error
Overview
After meshing, the software warned 'maximum non-orthogonality 75°'. How much should I worry?
Each quality metric ties to error in a particular calculation. Non-orthogonality affects the diffusion flux through a face (transport of heat or momentum). If the line joining cell centres isn't perpendicular to the face, their difference alone can't give the face-normal gradient correctly. At 75°, the uncorrected flux is off by over 70%, and even with correction the calculation tends to be unstable. What matters more than the maximum, though, is where the bad cells are: fix them in important flow regions, tolerate them where influence is small.
Non-orthogonality
The non-orthogonal angle $\theta$ is between the centre-to-centre vector $\mathbf d$ and the face normal. Uncorrected, the face-normal gradient is underestimated by a factor of $\cos\theta$.
Expansion ratio
When neighbouring widths differ ($h_+ \ne h_-$), the leading central-difference error term survives in proportion to the first power of spacing. Refining with a fixed expansion ratio drops accuracy to first order.
Meshing is half the job
In early CFD, in the 1970s–80s, people built body-fitted structured grids largely by hand, and meshing consumed most of the analysis time. When automatic tetrahedral meshing spread in the 1990s, complex shapes could be meshed quickly, but distorted cells brought accuracy loss and divergence. Quality metrics such as non-orthogonality and expansion ratio, and correction methods to compensate, were developed in response. Today's detailed mesh-quality reports in general-purpose codes are the fruit of that experience.
Worked examples
Example 1: non-orthogonal angle and flux error
| Angle | 10° | 20° | 30° | 45° | 60° | 70° | 80° |
|---|---|---|---|---|---|---|---|
| Uncorrected flux error | 1.5% | 6.0% | 13.4% | 29.3% | 50.0% | 65.8% | 82.6% |
For a uniform gradient, non-orthogonal correction removes the error entirely. But the correction is added using the previous iteration's gradient, so at large angles it dominates and destabilises iteration.
Example 2: expansion ratio and difference accuracy
The second derivative of $e^x$ (exact value 1) was computed with a three-point difference at a fixed neighbour width ratio $r$:
| Ratio r | Spacing 0.1 | 0.05 | 0.025 | Order |
|---|---|---|---|---|
| 1.0 | 8.3×10⁻⁴ | 2.1×10⁻⁴ | 5.2×10⁻⁵ | 2.00 |
| 1.1 | 4.3×10⁻³ | 1.9×10⁻³ | 8.9×10⁻⁴ | 1.09 |
| 1.2 | 7.7×10⁻³ | 3.6×10⁻³ | 1.7×10⁻³ | 1.05 |
| 1.5 | 1.8×10⁻² | 8.7×10⁻³ | 4.3×10⁻³ | 1.03 |
| 2.0 | 3.6×10⁻² | 1.7×10⁻² | 8.5×10⁻³ | 1.03 |
Even at ratio 1.2 the error is nine times larger and first order.
Right. Refining at a fixed ratio keeps the width difference proportional to spacing, so the leading error term never vanishes. When studying grid dependence, ideally the ratio approaches 1 as you refine. The 1.2–1.3 used in boundary-layer prism layers is a compromise to capture steep near-wall changes with few cells; in exchange, watch the ratio at the transition so cell size doesn't jump away from the wall.
Quality guidelines and remedies
- Aim for non-orthogonality below about 70° and locate cells exceeding it.
- Keep expansion ratio around 1.2 or below, avoiding jumps at the boundary-layer transition.
- High-skewness cells degrade face interpolation; avoid them in important flow regions.
- High aspect ratio is usually fine when aligned with the flow (as in boundary layers).
- Don't judge by metrics alone; confirm results via a grid-dependence study.
“One cell stopped the run”
A multi-million-cell flow calculation diverged partway every time. Tracking where residuals were largest revealed a single almost-collapsed cell with 88° non-orthogonality where a narrow gap had been filled. Overall average quality was excellent, so it had been overlooked. Slightly simplifying the geometry there and remeshing let the calculation converge stably. Judge quality by the worst cells and their locations, not the average.
Common mistakes
Mistakes and fixes
| Mistake | Effect | Fix |
|---|---|---|
| Judging quality by average | Worst cell causes divergence | Check worst values and locations |
| Abrupt expansion | Accuracy drops to first order | Keep ≈1.2 or below |
| Disabling non-orthogonal correction | Diffusion flux error | Use correction and limit angles |
| Worrying only about aspect ratio | Real cause missed | Judge relative to flow direction |
| Assuming good quality is enough | Insufficient resolution missed | Check grid dependence |
I'd like to learn related topics.
For grid checks see mesh independence; boundary-layer meshing, inflation layers; cell types, polyhedral meshes, hex-dominant meshes and structured meshes; differencing behaviour, the central difference scheme.
Related Topics
Experience the theory firsthand with the interactive simulator for this field
All Simulators