Injection Foaming Molding Analysis
Theory: bubble nucleation, growth and part performance
Overview
How does foam molding analysis differ from ordinary injection molding analysis?
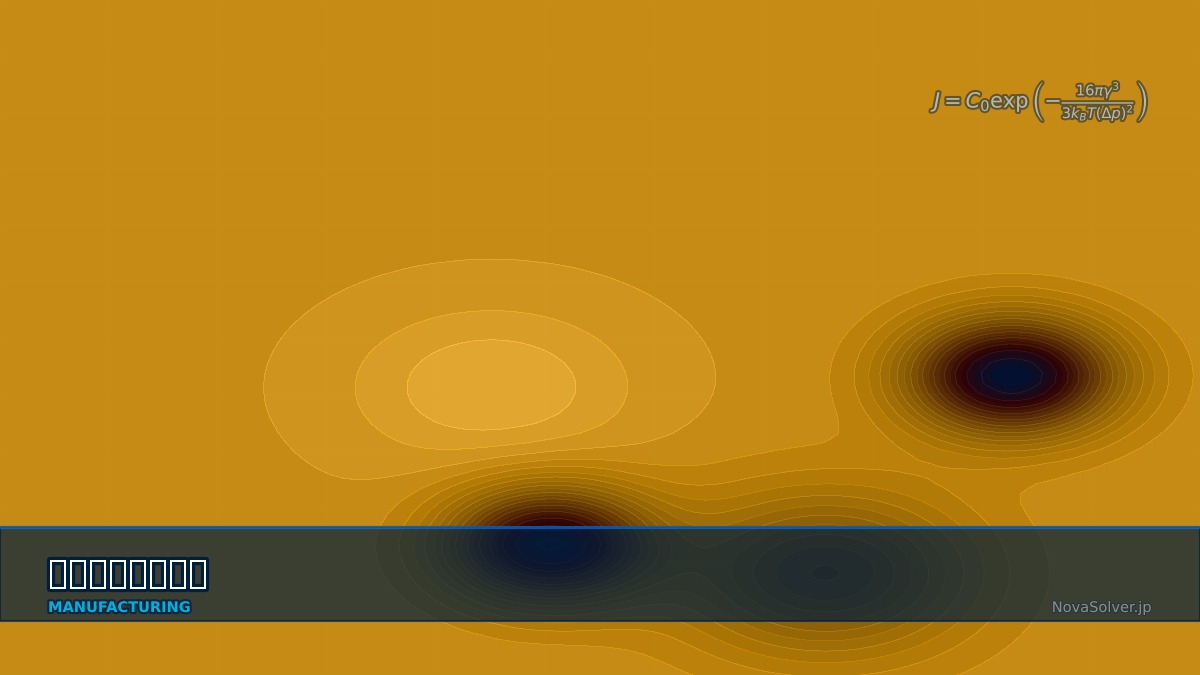
It adds bubble nucleation and growth. Gas dissolved in the resin forms bubble nuclei when pressure drops below what keeps it dissolved (nucleation), and gas diffuses from the surrounding resin to inflate them (growth). Foam analysis computes bubble number (nucleation rate) and size (growth rate) from each point's pressure and temperature history during filling, giving local density and the pressure produced by expanding bubbles. Because bubble expansion replaces packing pressure, packing is thought about differently from ordinary moulding, and sink marks and warpage fall. Surfaces touching the mould freeze early with almost no bubbles, forming solid skins. Part strength and stiffness depend strongly on skin thickness and core density, so predicting them is the analysis's main purpose.
Density-stiffness relations
E* and ρ* are foam modulus and density, E_s and ρ_s those of the unfoamed resin, D plate bending stiffness, t thickness, c foamed-core thickness and E_c core modulus.
Microcellular foam from MIT
Microcellular foaming, with bubbles kept to about 10 µm or less, was studied in the 1980s in Nam P. Suh's group at MIT as a way to use less material while keeping strength. It reached production as MuCell, which dissolves supercritical nitrogen or CO₂ into the resin before injection, and is used in automotive interior parts and elsewhere to cut weight and improve dimensional accuracy.
Worked examples
E*/E_s = (ρ*/ρ_s)² is an assumed unit-coefficient model, not a guaranteed law for all microcellular materials. Assume perfect skin-core bonding, equal Poisson ratios, a symmetric section and small deformation. Measure material-specific coefficients, exponents and cellular structure.
Example: weight saving and bending stiffness of a 2 mm part
| Foaming | Mass | Bending stiffness | Mass at restored stiffness |
|---|---|---|---|
| No foaming | 100% | 100% | — |
| Uniform density 0.90 | 90% | 81% | 96.5% (thickness +7.3%) |
| Uniform density 0.86 | 86% | 74% | 95.1% (thickness +10.6%) |
| 0.3 mm skins ×2 + 1.4 mm core (density 0.8) | 86% | 88% | — |
For the same 14% weight saving, uniform foaming drops stiffness to 74% while keeping skins retains 88%. Restoring stiffness by thickening a uniformly foamed part gives back most of the weight saving.
The analysis showed uniform core density 0.8, but sectioning the trial revealed large bubbles clustered at the end of flow. What did I miss?
Check how pressure falls at the flow end and whether bubbles coalesce. The flow end fills last, at low pressure and with cooler resin. If nuclei form early, bubbles grow for a long time before reaching the end, and neighbours merge into large ones. Looking only at average bubble size in the analysis hides this bias. Remedies include faster injection to shorten the low-pressure period, gas counter-pressure in the mould to suppress foaming during filling, and less gas. In the analysis, check the bubble-size distribution by location and where and when pressure first falls below the nucleation pressure during filling. If solubility or diffusivity data are off, growth rates shift, so calibrating against bubble sizes in sectioned trials is the reliable route.
Practical workflow
- Prepare gas type and content, and the material's solubility and diffusivity data.
- Compute pressure and temperature histories in filling analysis, then bubble nucleation and growth.
- Check skin thickness, core density and bubble-size distribution.
- Evaluate part stiffness and strength from the density distribution; adjust thickness or foaming ratio.
- Measure bubbles and skins in sectioned trials and calibrate material data.
“Swirl marks on the surface”
Foam-moulded surfaces readily show silver streaks and swirl marks where bubbles are pressed against the mould. For appearance parts this is a major problem, addressed by raising mould temperature only during filling or suppressing surface foaming with counter-pressure. Analysis can predict where surface bubbles are likely from pressure and temperature at the flow front, so it is also used to work out cosmetic fixes.
Common mistakes
Mistakes and fixes
| Mistake | Effect | Fix |
|---|---|---|
| Predicting stiffness from density alone | Misses material and cellular structure | Calibrate coefficients and exponent |
| Ignoring skins | Stiffness underestimated | Predict skin thickness |
| Average bubble size only | Coarse bubbles at flow end missed | Distribution by location |
| Using ordinary packing settings | Over-suppressed foaming | Consider short or no packing |
| Data for another grade | Wrong bubble growth | Calibrate with sectioned bubbles |
I'd like to learn related topics.
Related pages include injection molding filling analysis, injection molding cooling analysis, injection molding warpage analysis and fiber orientation analysis.
Frequently asked questions
What is foam injection molding?
A process that dissolves gas (nitrogen or CO₂ as a supercritical fluid) or a chemical blowing agent into molten resin and forms fine bubbles as pressure drops in the mould. Parts become lighter; bubble expansion replaces packing pressure, reducing sink marks and warpage, and clamp force can be lowered. Physical foaming such as MuCell is a representative method.
How much does foaming reduce stiffness?
Foam modulus scales roughly with the square of relative density (Gibson-Ashby). Foaming a 2 mm part uniformly to density 0.9 lowers modulus and bending stiffness to about 81%. Restoring stiffness needs about 7% more thickness, leaving the mass at about 96.5% of the original — only about 3.5% lighter.
Why does the skin layer matter?
Because bending stiffness depends most on material near the surfaces. Surfaces that touch the mould freeze early, forming nearly bubble-free solid skins. Keeping 0.3 mm skins on a 2 mm part and foaming only the 1.4 mm core to density 0.8 gives 86% of the mass (14% lighter) while retaining about 88% of bending stiffness. Predicting this skin thickness is a key goal of the analysis.
References and scope of verification
Numbers are educational reference calculations under the stated assumptions. Sources document theory and setup, not proof that these numerical values were reproduced in each package. Engineering decisions require validation for the actual conditions.
Related Topics
Experience the theory firsthand with the interactive simulator for this field
All Simulators