Roache GCI(Grid Convergence Index)
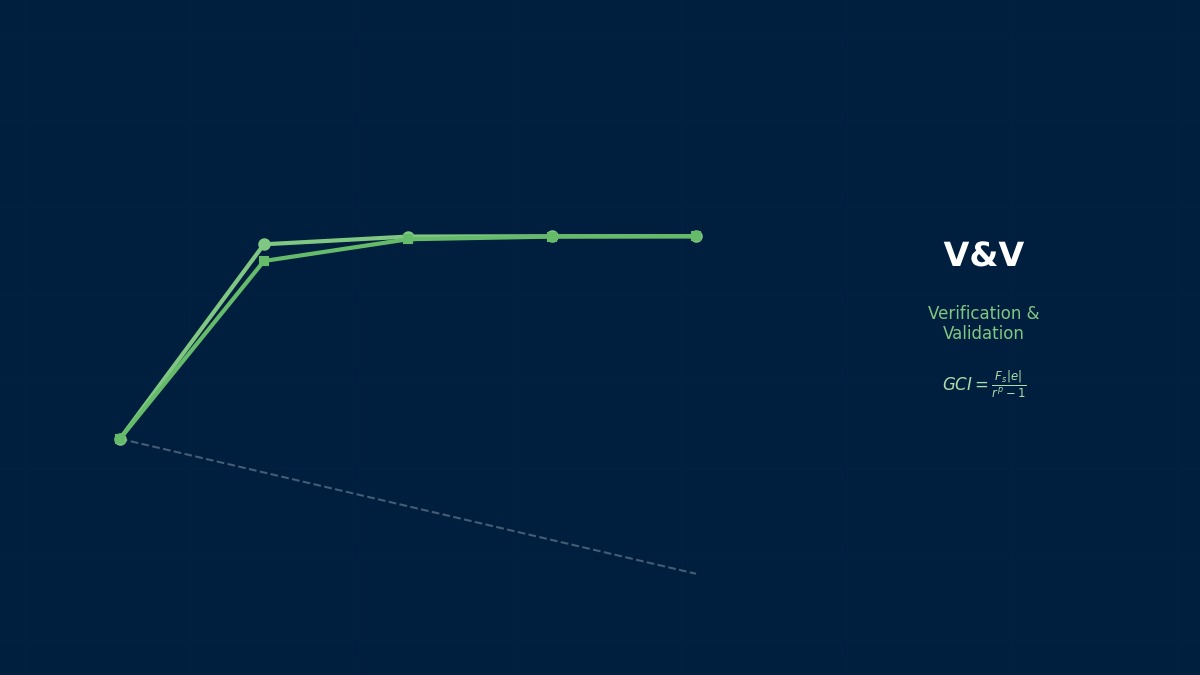
Theory: estimating error by varying the grid
Overview
A reviewer asked me to show grid dependence with the GCI. Is it just three grids plugged into a formula?
Basically, yes — but there are checks before and after the formula. The GCI assumes error decreases regularly with refinement (the asymptotic range), uses Richardson extrapolation to estimate the infinitely fine value, and multiplies the difference from your grid by a safety factor to give an error band. So if results oscillate or the observed order is far from the formal one, the number loses meaning. Let's walk through the steps, including computing order with non-constant refinement ratios.
Refinement ratio and order
$N$ is cell count, subscript 1 the finest grid. $\varepsilon_{21} = \phi_2 - \phi_1$, and $s$ is the sign of $\varepsilon_{32}/\varepsilon_{21}$. With equal ratios $q = 0$ and the order follows directly; otherwise iterate (the Celik et al. procedure).
Extrapolated value and GCI
“We refined the grid” isn't enough
Until the 1980s many fluids papers simply stated that refining the grid didn't change results, without showing by how much. In 1986 the ASME Journal of Fluids Engineering adopted a policy requiring numerical accuracy to be reported, and in 1994 Roache proposed the Grid Convergence Index as a uniform way to report grid error quantitatively. In 2008 Celik and colleagues set out a practical GCI procedure. It is now standard in verification standards such as ASME V&V 20.
Worked example: drag coefficient on three grids
Drag coefficient was computed on 3D grids of 100,000, 42,000 and 18,000 cells. Refinement ratios r21 = 1.335 and r32 = 1.326 (not constant); the scheme is second order.
| Case | Fine / medium / coarse | Order | Extrapolated | GCI (fine) | Verdict |
|---|---|---|---|---|---|
| A monotone | 1.2231 / 1.2285 / 1.2376 | 1.91 | 1.2158 | 0.75% | Usable |
| B oscillatory | 1.2231 / 1.2262 / 1.2189 | 3.01 (meaningless) | — | 0.23% (too small) | ±0.30% from range |
| C order too high | 1.2231 / 1.2285 / 1.2412 | 3.08 | 1.2193 | 0.38% | Cap p at 2: 0.70% |
Case C computes a smaller GCI, yet we deliberately use a larger value?
An order of 3.08 from a second-order scheme means either the grids aren't yet in the range where error decreases regularly, or errors are cancelling by chance. Used as is, extrapolation overshoots and underestimates the error band. So cap the order at the formal 2 and conservatively report 0.70%. When results swing up and down as in case B, the order formula itself is meaningless, so take half the swing (±0.30%) as the uncertainty guide. With only two grids, assume order 2 and use safety factor 3 — 1.69% in the example. The effort of a third grid pays back directly as a tighter error band.
Procedure summary
- Build three grids with ratio at least 1.3, refined uniformly in all directions with the same topology.
- Make iterative convergence error much smaller than discretisation error.
- For each quantity, check the sign of differences (monotone or oscillatory) and the order.
- If the order departs far from formal, cap it or add grids.
- Report extrapolated values, GCI and order in a table.
“GCI goes wild for local values”
A wing's total lift gave a clean 0.5% GCI, but at a pressure point near the trailing edge the order came out negative or above 10, and no GCI could be computed. Local values often don't decrease monotonically because the cell arrangement near the probe changes between grids; integrated quantities (lift, drag) average errors and behave well. To assess local values, refine grids similarly, use consistent interpolation, and add a fourth grid if needed. Remember GCI reliability differs by quantity.
Common mistakes
Mistakes and fixes
| Mistake | Effect | Fix |
|---|---|---|
| Applying the formula to oscillating results | Error underestimated | Use the oscillation range |
| Using observed order uncritically | Over-extrapolation | Cap at formal order |
| Small ratio (e.g. 1.1) | Differences lost in iteration error | 1.3 or more |
| Refining one direction only | Erratic order | Refine all directions similarly |
| Fs 1.25 with two grids | Band too narrow | Fs 3 |
I'd like to learn related topics.
Try order and extrapolation with the Richardson extrapolation tool. Related pages include three-grid GCI, Richardson extrapolation, solution verification, code verification and ASME V&V 20.
Related Topics
Experience the theory firsthand with the interactive simulator for this field
All Simulators