Heat Treatment (Quenching) Simulation
Theory: cooling decides the microstructure
Overview
We water-quenched an 80 mm shaft; the surface is hard but the core stayed soft. Why?
Quench hardening comes from cooling austenite fast enough to form martensite before other transformations occur. The surface cools immediately in contact with the quenchant, but core heat must conduct out through the steel. The thicker the part, the longer it takes, so the core cools slowly and forms soft structures — the mass effect. Quench simulation starts by computing the internal temperature history with heat-transfer analysis.
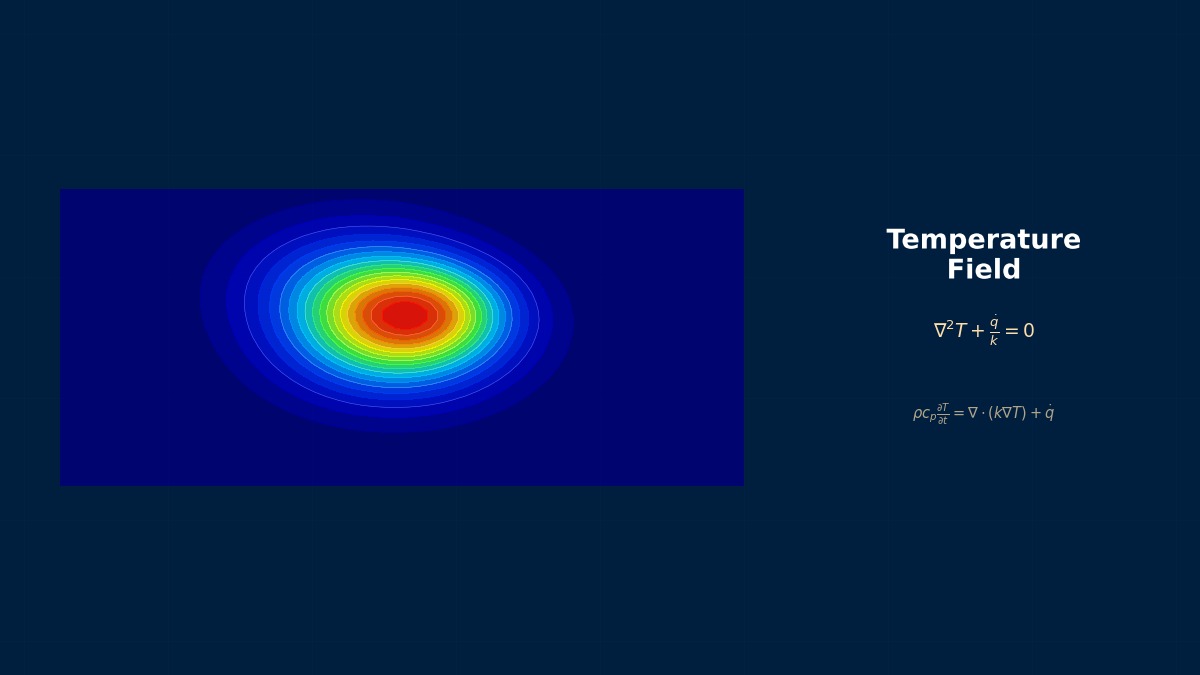
Heat conduction in a round bar
Transient radial conduction with heat transfer to the quenchant at the surface. In reality $h$ changes greatly through the vapour-blanket, nucleate-boiling and convection stages; here it is held constant.
Above a Biot number of 1, surface–centre differences grow large. $t_{8/5}$, the cooling time from 800 to 500 °C, indicates whether hardening occurs; the required value varies greatly by steel grade, so check the continuous-cooling-transformation diagram.
The swordsmith's water and oil
Quenching has long been used for swords and blades. For Japanese swords, a clay coating is applied thinly over the edge and thickly over the spine before plunging into water. The edge cools fast and hardens; the spine cools slowly and stays tough. The martensite transformation expands the edge, creating the sword's characteristic curve. Varying cooling by location to shape both microstructure and form is exactly the thermal–metallurgical–mechanical coupling that modern quench simulation handles.
Worked example: quenching round bars
Steel round bars at 850 °C enter 50 °C quenchants. Conductivity 30 W/mK, volumetric heat capacity 4.6 MJ/m³K; heat transfer coefficients water 5,000, polymer 2,500, oil 1,200 W/m²K (constant). Cooling time from 800 to 500 °C (s):
| Diameter | Water centre | Water surface | Polymer centre | Oil centre | Oil surface |
|---|---|---|---|---|---|
| 10 mm | 1.5 | 1.0 | 2.6 | 5.1 | 5.0 |
| 25 mm | 5.1 | 1.6 | 7.9 | 14.0 | 11.9 |
| 50 mm | 15.2 | 1.9 | 20.6 | 32.5 | 19.9 |
| 100 mm | 50.0 | 2.3 | 60.7 | 84.1 | 27.2 |
At 100 mm, even water leaves the centre taking 50 seconds.
Right. Water chills the surface in 2.3 seconds, but core heat can only leave by conduction through the steel. A stronger quenchant speeds the core only modestly: switching a 100 mm bar from water to oil stretches the centre from 50 to 84 seconds — just 1.7 times. To harden thick parts to the core, choose a high-hardenability alloy steel that hardens even when cooled slowly; how many seconds a given steel tolerates is checked with continuous-cooling-transformation diagrams or Jominy tests.
Example 2: surface–centre temperature difference
| Diameter | Water | Polymer | Oil |
|---|---|---|---|
| 10 mm | 213 K | 126 K | 68 K |
| 25 mm | 373 K | 248 K | 146 K |
| 50 mm | 506 K | 373 K | 241 K |
| 100 mm | 618 K | 506 K | 365 K |
Larger differences mean larger thermal stress and more out-of-step transformation between surface and core, promoting distortion and quench cracking. Polymer solutions are widely used as a middle ground between water's speed and oil's gentleness.
Analysis workflow
- Obtain the quenchant heat transfer coefficient as a function of surface temperature from tests (cooling-curve measurements).
- Run heat transfer with temperature-dependent conductivity and specific heat, including latent heat of transformation.
- Predict microstructure and hardness distribution from CCT diagrams or transformation-kinetics models.
- Compute residual stress and distortion from temperature differences and transformation expansion.
- Compare with hardness surveys, sectioned microstructures and distortion measurements.
“Same conditions, different distortion every time”
Oil-quenched gears showed distortion varying from lot to lot. Investigation found that operators immersed parts at different angles and speeds, so the vapour blanket broke at different times on different faces. Heat transfer is low during the vapour stage and jumps when the blanket collapses, so a different collapse order creates uneven cooling. Standardising immersion with a fixture and agitating the oil to break the blanket sooner reduced the scatter. Quench analysis should treat the heat transfer coefficient as varying with location and time, not as a constant.
Common mistakes
Mistakes and fixes
| Mistake | Effect | Fix |
|---|---|---|
| Constant heat transfer coefficient | Vapour stage missed | Make it a function of surface temperature |
| Relying on quenchant for core cooling | More cracking and distortion | Choose higher-hardenability steel |
| Ignoring transformation latent heat | Cooling curve off | Include latent heat |
| Ignoring agitation and immersion | Distortion scatter | Model process conditions |
| Judging hardness from temperature alone | Microstructure misjudged | Couple with transformation models |
I'd like to try related calculations.
Try the Jominy hardenability tool, lumped capacitance calculator, heat treatment simulator and Biot number calculator. Related processes include tempering, induction hardening and furnace simulation.