Frequency Sweep and Resonance Evaluation
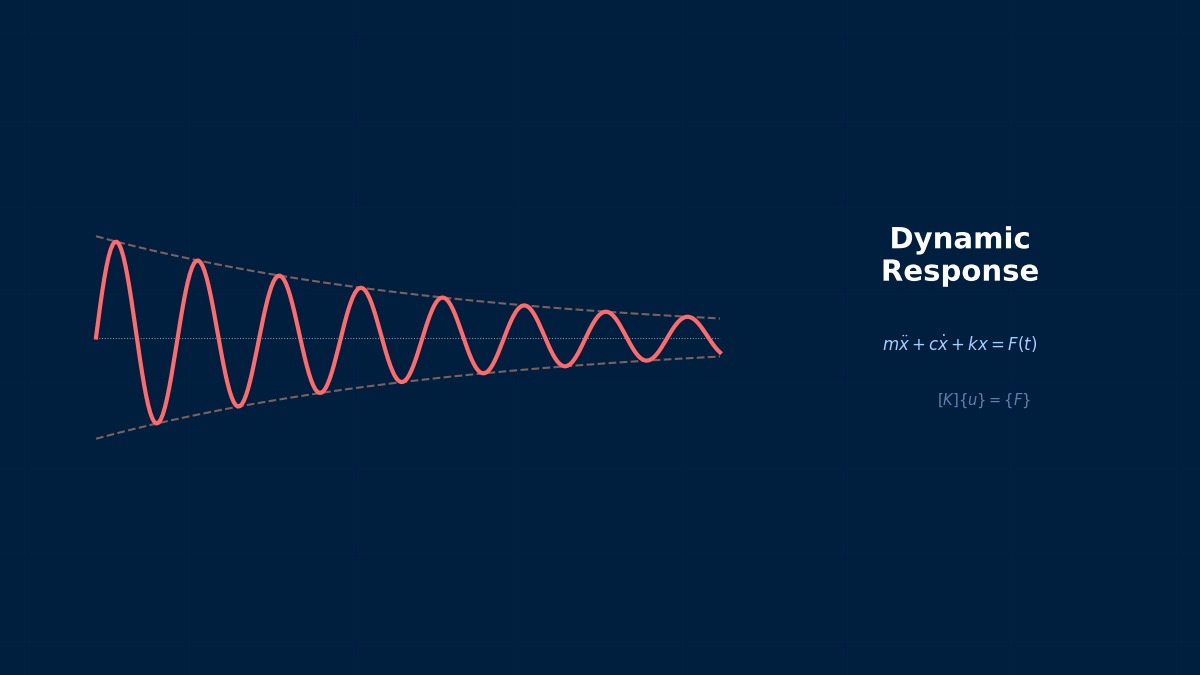
Frequency Sweep and Resonance Evaluation: Theoretical Foundations
What is Frequency Sweep?
Professor, what is a "frequency sweep"?
It's a method to continuously vary the frequency of an external force from low to high and calculate the response. It's a fundamental approach to obtain the FRF (Frequency Response Function).
So, in essence, it means "calculating sequentially from 1 Hz to 500 Hz"?
Yes. Plotting the response (displacement, acceleration, stress) at each frequency allows you to see the location and magnitude of resonance peaks at a glance.
Frequency Step Design
How to determine the frequency step depends on the nature of the resonance:
| Damping Ratio $\zeta$ | Resonance Peak Half-Power Bandwidth | Required Step |
|---|---|---|
| 0.1% (Very Low Damping) | $\Delta f \approx 0.002 f_n$ | Below 0.1 Hz |
| 1% (Steel Structure) | $\Delta f \approx 0.02 f_n$ | About 1 Hz |
| 5% (RC Structure) | $\Delta f \approx 0.1 f_n$ | About 5 Hz |
| 10% (Seismic Isolation) | $\Delta f \approx 0.2 f_n$ | About 10 Hz |
When damping is small, the peak is sharp, so a fine step is needed, right?
For low-damped steel structures, the step needs to be very fine. For a natural frequency around 100 Hz with $\zeta = 0.5\%$, the step should be below 0.5 Hz. A sweep of 500 points from 1 to 500 Hz with a 1 Hz step might miss the peak.
Logarithmic Step and Mode-Following Step
Efficient stepping methods:
1. Logarithmic Equal Spacing
Place frequencies at equal intervals on a logarithmic scale. Coarse at low frequencies, fine at high frequencies. Common in acoustic systems.
2. Mode-Following Step (Nastran's FREQ4)
Automatically places fine steps around each natural frequency to reliably capture resonance regions. Set using Nastran's FREQ4 card.
3. Adaptive Step
Automatically refines steps near resonance using Abaqus's BIAS parameter. If you specify the number of calculation points, they are automatically concentrated around resonance.
Resonance Evaluation
Resonance evaluation metrics:
| Metric | Definition | Purpose |
|---|---|---|
| Resonance Frequency | Peak position of FRF | Resonance avoidance design |
| Peak Amplitude | Maximum value of FRF | Maximum response evaluation |
| Half-Power Bandwidth | -3 dB width of peak | Damping ratio estimation |
| Phase Change | Approx. 180° change at resonance | Mode confirmation |
Is the FRF peak amplitude the most important in design?
Yes. Peak amplitude × Input force = Maximum response. Whether this maximum response is within allowable limits (displacement limit, acceleration limit, stress limit) is the design judgment.
Summary
Let me organize frequency sweep and resonance evaluation.
Key points:
- Vary frequency to obtain FRF — Identify resonance peaks
- Step size should be less than half-power bandwidth — $\Delta f < \zeta \cdot f_n$
- Efficiency with mode-following step (FREQ4) — Fine only near resonance
- Peak amplitude × Input = Maximum response — Basis for design judgment
- Confirm resonance with phase change — 180° phase jump
Resonance Changes with Sweep Rate
In frequency sweep tests, faster sweep rates (octaves/minute) can cause resonance peaks to appear "false". As shown by CW. de Silva in the 1950s, an apparent shift dependent on sweep rate occurs from the true resonance frequency. The current vibration test standard MIL-STD-810H recommends 4 octaves/minute or less, based on this theoretical background.
Computational Methods for Frequency Sweep and Resonance Evaluation
Frequency Step Setting
Please teach me how to set the frequency step in each solver.
Nastran
```
$ Equal spacing
FREQ1, 20, 1., 500., 1. $ 1 to 500 Hz, 1 Hz step
$ Mode-following (automatically finer near resonance)
FREQ4, 20, 1., 500., 0.1, 5 $ ±0.1 half-power bandwidth per mode, 5 points
$ Logarithmic equal spacing
FREQ2, 20, 1., 500., 10 $ 1 to 500 Hz, 1/3 octave
```
Abaqus
```
*STEADY STATE DYNAMICS
1., 500., 500, 1. $ 1 to 500 Hz, 500 points, BIAS=1 (equal spacing)
```
BIAS > 1 concentrates on high frequency, BIAS < 1 concentrates on low frequency.
Ansys
```
HARFRQ, 1., 500.
NSUBST, 500 ! 500 steps
```
Nastran's FREQ4 is the smartest stepping method, right?
FREQ4 automatically concentrates calculation points around each natural frequency. It can sometimes achieve equivalent accuracy with 10 times the efficiency of equal spacing. In practice, combining FREQ1 (coarse overall step) + FREQ4 (fine step near resonance) is most effective.
FRF Output and Visualization
Standard FRF display formats:
- Amplitude-Frequency Plot — Logarithmic scale (dB) is common
- Phase-Frequency Plot — 180° jump at resonance
- Nyquist Plot (Real vs. Imaginary Part) — Draws a circle at resonance
- Bode Plot — Displays amplitude and phase in two tiers
What is the dB scale?
$20 \log_{10}(|H|/H_{ref})$. Compresses large amplitude changes for easier viewing. Resonance peaks appear as +40 dB, anti-resonance as -40 dB, etc.
Summary
Let me organize the numerical methods for frequency sweep.
Key points:
- FREQ1 + FREQ4 (Nastran) is most efficient — Equal spacing + mode-following
- Concentrate distribution with BIAS (Abaqus) — Automatically concentrates on frequency bands of interest
- Display FRF in dB scale — Compresses wide dynamic range
- Confirm resonance with Nyquist plot — Draws a circle at resonance
Choosing Between Logarithmic Sweep and Linear Sweep
For low-frequency bands (1–100Hz), logarithmic sweep (constant octave) is standard, allocating equal time to each frequency. Linear sweep is used for high-frequency (1kHz+) precision measurement and electrical characteristic evaluation. Automotive shaker tests (ISO 16750-3) standardize logarithmic sweep at 1 octave/minute from 5–2000Hz. Even for the same test, resonance detection accuracy can differ by up to 3 times between logarithmic and linear.