Power Spectral Density Response Analysis
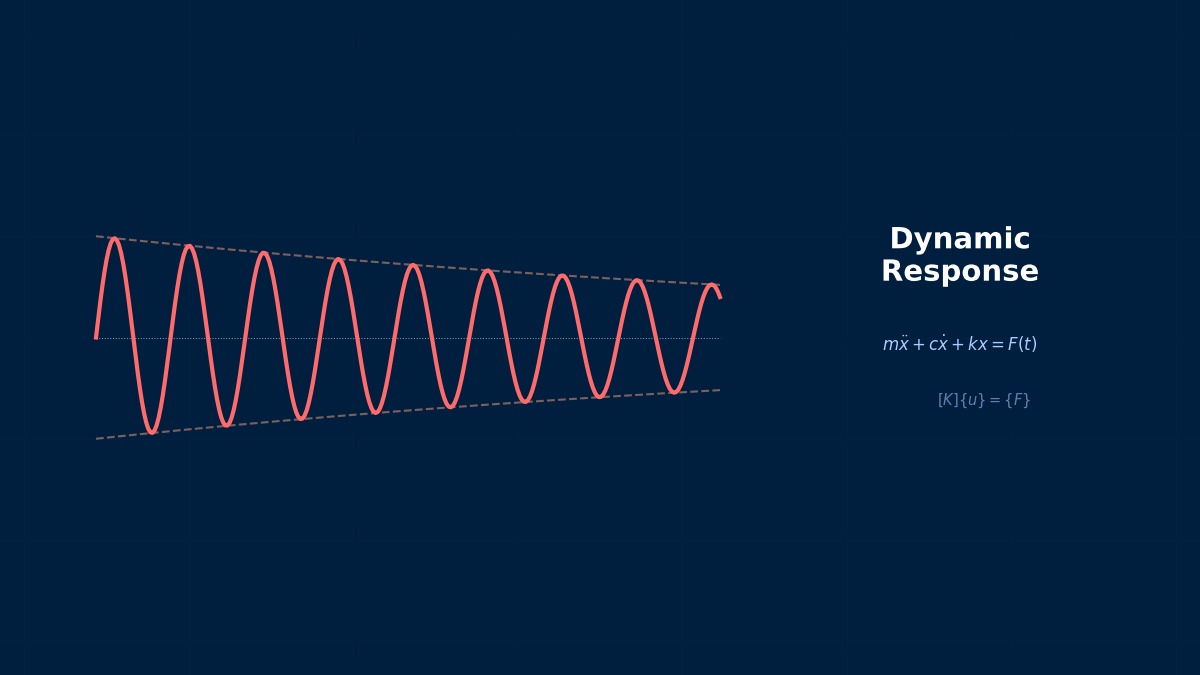
Power Spectral Density Response: Theoretical Foundations
What is PSD Response Analysis?
Professor, what is "PSD Response Analysis"?
It's a method to calculate a structure's response to Random Vibration (stochastic vibration input) in the frequency domain. PSD (Power Spectral Density) represents the frequency distribution of vibration energy.
Does random vibration not have a deterministic waveform?
Correct. Earthquakes, road surface roughness, jet engine acoustics, rocket launch vibrations... these are described not by deterministic time histories, but by statistical characteristics (PSD).
Input PSD and Response PSD
Basic formula for random vibration:
- $S_{in}(f)$ — Input PSD (acceleration $g^2$/Hz, force $N^2$/Hz, etc.)
- $H(f)$ — Frequency Response Function (FRF)
- $S_{out}(f)$ — Response PSD (displacement $mm^2$/Hz, stress $MPa^2$/Hz, etc.)
FRF squared × input PSD = output PSD. That's simple.
PSD response analysis uses the results of frequency response analysis. First, obtain the FRF $H(f)$ (modal method or direct method), then just multiply by the input PSD $S_{in}(f)$. Additional computational cost is almost zero.
RMS Value
The RMS (Root Mean Square) value of the response is the integral of the response PSD:
The square root of the PSD area is the RMS. So RMS is an indicator of the "magnitude of vibration," right?
In random vibration design, 3σ (3×RMS) is used as an estimate for the maximum response. Assuming a normal distribution, the amplitude is within 3σ with 99.7% probability. 3σ is often used as a design safety factor.
Nastran
```
SOL 111 $ Modal frequency response
CEND
METHOD = 10
RANDOM = 20
BEGIN BULK
RANDOM, 20, , FREQ, TABRND1, 100
TABRND1, 100, , ,
, 20., 0.01, 200., 0.01, 500., 0.04, 2000., 0.04, ENDT
```
Abaqus
```
*STEP
*RANDOM RESPONSE
20., 2000., 100, 1.
*PSD DEFINITION, NAME=base_psd, TYPE=BASE
20., 0.01
200., 0.01
500., 0.04
2000., 0.04
*END STEP
```
So the input PSD is defined by a table (frequency vs. PSD value).
In aerospace, random vibration spectra from MIL-STD-810 or NASA-STD-7001 are specified as PSD. This PSD table is input into the FEM.
Summary
Key points:
- $S_{out} = |H|^2 \cdot S_{in}$ — FRF squared × input PSD = output PSD
- RMS = $\sqrt{\int S_{out} df}$ — Effective value of response
- 3σ is an estimate for maximum response — 99.7% of normal distribution
- PSD version of frequency response analysis — Almost zero additional cost
- SOL 111 + RANDOM (Nastran), *RANDOM RESPONSE (Abaqus)
Definition of PSD (Power Spectral Density)
Power spectral density S(f) is defined as the mean square value per unit frequency bandwidth, with units like G²/Hz or Pa²/Hz. According to the Wiener-Khinchin theorem (proven independently by Norbert Wiener and Aleksandr Khinchin in the 1930s), PSD is equal to the Fourier transform of the autocorrelation function. For estimation from measured data, Welch's overlapped segment averaging method (proposed in 1967) is standard, controlling the trade-off between frequency resolution and variance via window width.
Computational Methods for Power Spectral Density Response
PSD Analysis Calculation
How is the PSD response calculated?
1. Natural Frequency Analysis (SOL 103 / *FREQUENCY)
2. Frequency Response Analysis (SOL 111 / *SSD) → Obtain FRF $H(f)$
3. PSD Response Calculation — $S_{out}(f) = |H(f)|^2 \cdot S_{in}(f)$
4. RMS Value Calculation — $x_{rms} = \sqrt{\int S_{out} df}$
Steps 3 and 4 are post-processing of the FRF; no additional analysis is required.
Multi-Degree-of-Freedom System PSD Response
For multi-degree-of-freedom systems, cross-modal correlation terms are also considered:
The correlation terms reflect "mode overlap". They are important for closely spaced modes.
Typical Examples of Input PSD
| Standard | Frequency Range | PSD Value |
|---|---|---|
| MIL-STD-810 Method 514 | 20 to 2000 Hz | 0.04 g²/Hz (flat portion) |
| NASA-STD-7001 | 20 to 2000 Hz | Level dependent |
| IEC 60068-2-64 | 10 to 500 Hz | Product category dependent |
Summary
PSD Estimation Procedure via Welch's Method
PSD estimation via Welch's method follows these steps: ① Split time series data with 50% overlap (typically 512~4096 points per segment), ② Apply Hann window to each segment and perform FFT, ③ Normalize the squared absolute value of the FFT by sampling interval and number of segments, then average. In Python, this can be done in one line with scipy.signal.welch(x, fs, nperseg=1024). Vibration testing standard ASTM E1049 recommends setting recording time so that statistical degrees of freedom are at least 120 (approximately 60 segments or more).
Related Topics
Experience the theory firsthand with the interactive simulator for this field
All Simulators