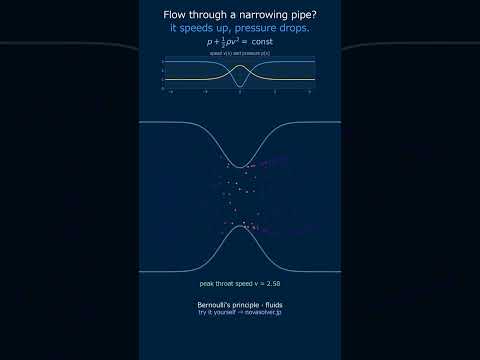
Configure inlet/outlet diameter, pressure, velocity, and elevation to visualize venturi pipe flow in real time. Continuity equation, dynamic pressure, and total head calculated automatically.
CAE Note
Use this tool to verify CFD results (OpenFOAM / ANSYS Fluent) before running full simulations. Also applies to venturi meter and orifice plate design, HVAC pressure-drop estimation, and pump head calculations. Real pipelines require additional friction loss via Darcy-Weisbach.
Theory & Key Formulas
Bernoulli's equation (conserved along a streamline):
$$P_1+\frac{1}{2}\rho v_1^2+\rho g z_1=P_2+\frac{1}{2}\rho v_2^2+\rho g z_2$$
Total head: $H = \dfrac{P}{\rho g}+ \dfrac{v^2}{2g} + z$
What is Bernoulli's Theorem in Pipe Flow?
🙋
What exactly is Bernoulli's Theorem? I see pressure, velocity, and height in the equation, but how do they relate in a real pipe?
🎓
Basically, it's the "energy budget" for a fluid. In a steady, frictionless flow, the total mechanical energy per unit volume is constant. For instance, if a pipe narrows, the fluid speeds up (velocity term increases), so its pressure must drop to keep the sum constant. Try reducing the outlet diameter D₂ in the simulator above and watch the pressure gauge drop!
🙋
Wait, really? So if I increase the inlet pressure P₁ with the slider, does that just make everything faster?
🎓
Not exactly! The continuity equation $A_1 v_1 = A_2 v_2$ locks the velocity ratio based on pipe area. If you crank up P₁, Bernoulli's equation tells us that the extra energy has to go somewhere. With fixed diameters, the outlet velocity v₂ is fixed, so the extra energy manifests as a higher outlet pressure P₂. Try it—increase P₁ and see both pressure gauges rise.
🙋
That makes sense. But what about the elevation Δz? When would that matter in practice?
🎓
Great question! Elevation represents gravitational potential energy. A common case is water pumped uphill. If the outlet is higher (positive Δz), the $\rho g z$ term increases, so pressure or velocity must decrease to compensate. In the simulator, set a large positive Δz and watch P₂ drop—this is the "head" required to lift the fluid, crucial for pump sizing.
Physical Model & Key Equations
The core principle is conservation of mechanical energy along a streamline for an ideal (inviscid, incompressible) fluid. The total head, or energy per unit weight, is constant.
$$P_1+\frac{1}{2}\rho v_1^2+\rho g z_1=P_2+\frac{1}{2}\rho v_2^2+\rho g z_2$$
P is static pressure (Pa), ρ is fluid density (kg/m³), v is flow velocity (m/s), g is gravity (9.81 m/s²), and z is elevation (m). Each term is an energy density: Pressure, Kinetic, and Potential.
This equation is solved together with the continuity equation, which enforces mass conservation for a steady, incompressible flow.
A is cross-sectional area (m²) and D is diameter (m). This shows the inverse relationship: velocity increases when the pipe constricts. In the simulator, changing D₁ or D₂ directly alters v₂ via this relationship before Bernoulli's equation balances the pressure.
Frequently Asked Questions
According to the continuity equation, the smaller the cross-sectional area, the higher the flow velocity. As the velocity increases, the dynamic pressure rises, and due to Bernoulli's theorem, the static pressure decreases. This pressure difference is the principle of the Venturi tube, and the simulator allows you to observe changes in the velocity field and pressure distribution in real time.
Bernoulli's theorem includes a term for potential pressure (ρgz), and a difference in height affects the static pressure and flow velocity. For example, if the outlet is higher than the inlet, the static pressure decreases by the amount the potential pressure increases. Changing the height difference in the simulator reflects this effect in the pressure distribution and flow velocity, making it useful for practical pipeline design.
This tool assumes an ideal state of inviscid and incompressible fluid. Actual fluids involve frictional losses due to viscosity and the effects of turbulence, so errors occur especially in areas of sudden expansion or contraction. Additionally, it cannot be applied to gases with variable density. Please use it solely for understanding basic principles.
Flow velocity is displayed in m/s, and pressure in Pa (Pascals). Please enter settings in the same units. The density defaults to water (1000 kg/m³), but by changing the density value, you can also handle fluids such as air or oil. The gravitational acceleration is fixed at 9.81 m/s².
Real-World Applications
Venturi Meters & Orifice Plates: These are flow measurement devices that use a constriction to create a predictable pressure drop. By measuring P₁ and P₂ across the narrow throat (simulated by reducing D₂), engineers use Bernoulli's equation to calculate the flow rate. It's a direct application of the trade-off you see in the simulator.
HVAC System Design: Designing ductwork for heating and ventilation requires understanding how pressure changes with duct size and airflow speed. Engineers use Bernoulli's principle to ensure air is delivered with sufficient pressure to all vents, balancing duct diameters and fan power.
Aerodynamic Lift (Simplified): While the full story is complex, Bernoulli's principle explains part of how wings work. Air moving faster over the curved top surface has lower pressure than the slower air underneath, creating net upward force—a direct pressure-velocity trade-off.
Pump and Turbine Sizing: The "head" a pump must provide is calculated from Bernoulli's equation, considering the required pressure increase, velocity change, and elevation gain (Δz) in the system. Conversely, turbines extract energy, reducing the total head from inlet to outlet.
Common Misconceptions and Points to Note
When playing with this simulator, you might be tempted to think of Bernoulli's theorem as a "magic law." The first key point to grasp is that it relies on three major assumptions: inviscid, incompressible, and steady flow. For instance, water is nearly incompressible, but when air flows at high speeds, compressibility effects can no longer be ignored. In practical piping design, you should cultivate the habit of constantly questioning whether these assumptions hold true for your situation.
Next, do not confuse the relationship between inlet velocity v₁ and flow rate Q. While the simulator lets you directly change v₁, in the field, it's typically the pump or fan that determines the "flow rate." For example, for the same flow rate of 10 m³/h, simply changing the inlet diameter from 50mm to 100mm causes the inlet velocity v₁ to plummet from about 1.27 m/s to about 0.32 m/s. If you don't keep this "constant flow rate" in mind while adjusting parameters, you'll create a disconnect from reality.
Finally, consider the importance of pressure measurement location. The simulator clearly shows pressures at "section 1, 2," but in an actual venturi meter, the positions of the "static pressure taps" before and after the constriction are strictly defined. Otherwise, turbulence can cause measurement fluctuations. Don't naively convert a large ΔP (P₁-P₂) from a tool directly into a flow rate, or you'll get burned. Use this tool strictly for "understanding the principle" of ideal behavior.
Enter inlet diameter d₁ (mm) and outlet diameter d₂ (mm) for your pipe section
Input inlet pressure p₁ (kPa) and inlet velocity v₁ (m/s) from flow measurements or pump specifications
Click Calculate to solve for outlet velocity v₂, outlet pressure p₂, volumetric flow rate Q, dynamic pressure, and total head H using Bernoulli's equation
Examine the flow visualization showing velocity and pressure distribution across the diameter transition
Worked Example
A water distribution system reduces pipe diameter from 100 mm to 50 mm. At inlet: p₁=250 kPa, v₁=2.0 m/s, d₁=100 mm. Using continuity (A₁v₁=A₂v₂): outlet velocity v₂=8.0 m/s. Applying Bernoulli's equation with water density ρ=1000 kg/m³: p₂=250−(0.5×1000×(8.0²−2.0²))/1000=218 kPa. Flow rate Q=(π×0.05²/4)×8.0=15.7 L/s. Total head H=(250+2.0²/2g)/(ρg)=25.7 m.
Practical Notes
For HVAC duct sizing: velocity should not exceed 10 m/s in main ducts or noise generation and friction losses increase significantly
In irrigation systems with PVC pipes (DN50–DN100), account for 2–3% pressure drop per 100 m of equivalent length beyond Bernoulli's ideal calculation
Cavitation risk occurs when outlet pressure drops below vapor pressure (≈2.3 kPa absolute for water); reduce flow rate or increase inlet pressure if p₂ approaches this threshold
Dynamic pressure conversion: if your gauge reads 150 kPa at 3 m/s inlet, add kinetic energy term (ρv²/2=4.5 kPa) to find true static pressure