ASME V&V 10: Guide for Verification and Validation in Computational Solid Mechanics
Concepts: what makes a simulation credible
Overview
A customer wants us to “demonstrate the credibility of the analysis per ASME V&V 10.” What does that actually involve?
V&V 10 is ASME's 2006 guide to verification and validation in computational solid mechanics. Its core idea is that a simulation is not credible just because it ran; you show with evidence how far it has been checked. In practice: decide the intended use and required accuracy first, check code and solution errors (verification), compare with experiments to measure the gap to reality (validation), and document it all. Think of it less as a procedure and more as a map of the order in which to build up evidence.
Verification versus validation
| Item | Verification | Validation |
|---|---|---|
| Question | Are the equations solved correctly? | Are the right equations being solved? |
| Compared against | Analytical, manufactured or converged solutions | Experimental data |
| Content | Code verification (bugs, order of accuracy) and solution verification (discretisation error estimates) | Whether assumptions, materials and boundary conditions represent reality |
| Order | First | After verification |
The order matters. If you match experiments without knowing the discretisation error, you may cancel mesh-induced error by tweaking Young's modulus or friction. That tuning will fail under other conditions.
Model hierarchy and accuracy requirements
- Hierarchy: rather than validating the whole product at once, compare with experiments from the bottom up — material coupons, components, subassemblies, then the full system. Checking material and joint models at the lower levels lets you isolate the cause when a difference appears higher up (hierarchical validation).
- Set accuracy requirements first: decide from the intended use, before comparing, how close to the experiment the model must be. Setting the criterion after seeing the results lets any result pass.
- Design validation experiments together with the analysts: boundary conditions, loads and material properties must be measured in a form the model can use. Existing test data often lacks the records needed for a proper comparison.
How “V&V” became a standard
Systematic treatment of simulation credibility advanced greatly at US national laboratories after nuclear testing was restricted. With experiments no longer possible, predictions had to come from computation, and a methodology was needed to say how far those computations could be trusted. ASME formed committees in response, publishing V&V 10 for solid mechanics in 2006 and V&V 20 for fluids and heat transfer in 2009. V&V 40 (2018) for medical devices sets out how simulations can serve as evidence in regulatory submissions.
Worked example: cantilever tip deflection
Solution verification: three meshes and the GCI
Suppose three meshes, each halving the element size (fine, medium, coarse), give tip deflections of 12.40, 12.52 and 12.98 mm.
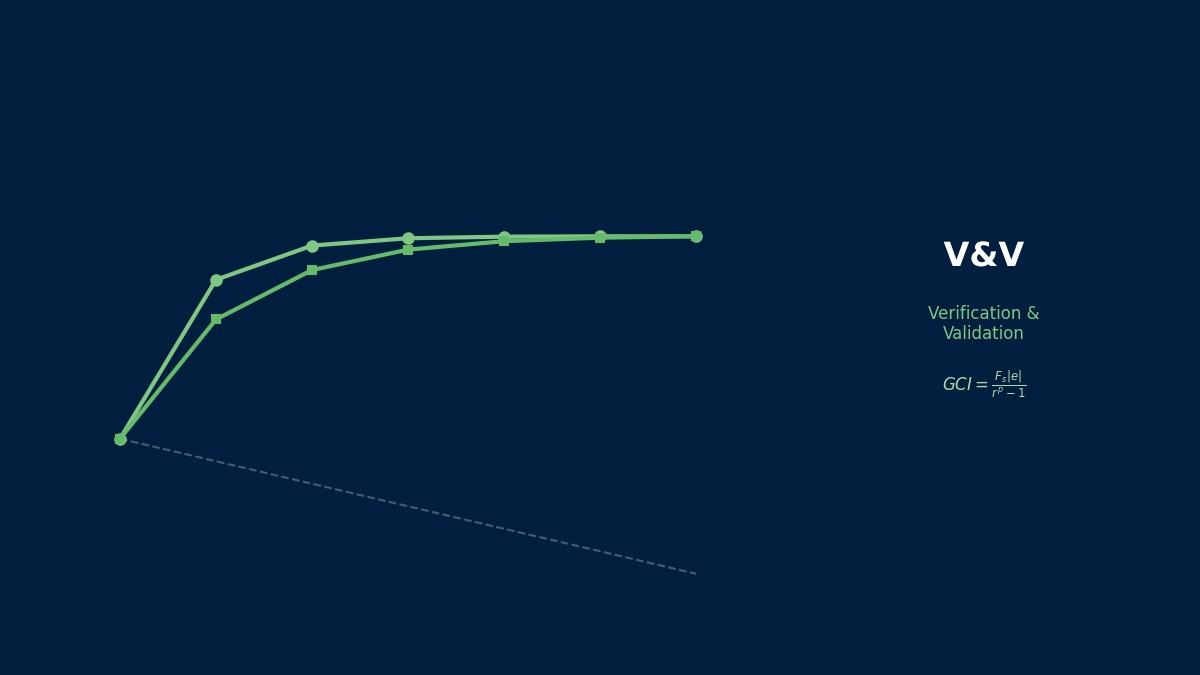
The observed order is $p \approx 1.94$ (close to the theoretical 2 for quadratic elements), the extrapolated value is about 12.36 mm, and the fine-mesh GCI is about 0.43% (0.053 mm). An observed order close to the theoretical one shows the meshes are in the asymptotic range, so the extrapolation can be trusted.
Validation: comparison including uncertainty
Five tests under the same conditions gave tip deflections of 11.6, 12.3, 11.9, 12.4 and 11.8 mm: mean $D = 12.00$ mm, standard deviation 0.34 mm. The comparison error $E$ against the simulation $S = 12.40$ mm and its uncertainty $u_{val}$ combine as follows:
| Uncertainty component | Value (standard) | Share of variance |
|---|---|---|
| Numerical (mesh) $u_{num}$: half the GCI | 0.026 mm | 0 % |
| Input (Young's modulus ±3%) $u_{input}$ | 0.372 mm | 85 % |
| Experiment (standard error of the mean) $u_D$ | 0.152 mm | 14 % |
| Combined $u_{val}$ | 0.403 mm | 100 % |
The comparison error is $E = 0.40$ mm. With $k = 2$ (about 95%), the model error itself lies between −0.41 and +1.21 mm. If the pre-set requirement was ±1.5 mm the model passes; if it was ±0.5 mm, this evidence cannot decide.
The mesh uncertainty is almost zero. I was about to refine the mesh further.
That's the biggest payoff of the procedure. 85% of the uncertainty comes from the scatter in Young's modulus, so to sharpen the conclusion you should measure the actual material's modulus, not refine the mesh. Showing with numbers where to spend time and money is the practical value of V&V.
Putting it into practice
What goes into a V&V plan
- The purpose of the analysis and the decision it will support (e.g. strength pass/fail, comparing design options)
- The quantities of interest and their accuracy requirements
- The model hierarchy and the validation experiments at each level
- How code verification will be done (analytical or manufactured solutions) and how solution verification will be done (mesh and time-step convergence)
- Which uncertainties will be considered (material, geometry, load, boundary conditions, experiment) and how they will be estimated
- How pass/fail will be judged and what will be documented
How it relates to other standards
| Standard | Scope | Characteristics |
|---|---|---|
| V&V 10 | Computational solid mechanics | The overall approach including planning, hierarchy and experiment design |
| V&V 10.1 | Worked illustration of the above | Uses a cantilever beam to illustrate probabilistic comparison methods |
| V&V 20 | CFD and heat transfer | Specifies how to treat the comparison error $E$ and $u_{val}$ |
| V&V 40 | Medical devices | Sets the required credibility from the model's influence on the decision and the consequence of being wrong |
The way uncertainties were combined in the example follows the approach of ASME V&V 20. For use with medical devices see ASME V&V 40.
Calibration is not validation
Tuning friction or damping until the model matches a test is calibration, not validation. Claiming agreement with the same data used for calibration proves nothing. The V&V 10 view is to keep calibration data and validation data separate and to judge whether the calibrated model can predict experiments under other conditions. Many analyses labelled “validated” in practice have, in fact, only been calibrated.
Common mistakes
Mistakes and fixes
| Mistake | Effect | Fix |
|---|---|---|
| Matching experiments before verification | Discretisation error is cancelled by tuning properties | Estimate error with mesh convergence and the GCI first |
| Setting the criterion after seeing results | Any result can be made to pass | Document accuracy requirements in the plan |
| Validating with the calibration data | Nothing is actually tested | Keep calibration and validation data separate |
| Ignoring experimental scatter | Judging on the difference from a single test | Use repeated tests and the standard error |
| Spending all the effort on mesh refinement | The dominant uncertainty is untouched | Look at the uncertainty budget and target the largest term |
I'd like to try the GCI calculation myself.
Enter your three mesh results into the grid convergence index simulator or the mesh convergence and Richardson extrapolation calculator to get the observed order and extrapolated value. The meaning of the order is explored in the observed order of accuracy simulator, and how scattered inputs spread into results in the Monte Carlo statistics simulator.