Frictional Heat Generation Simulation
Theory: heat from friction and where it goes
Overview
Our brake discs develop fine cracks, even though the calculated disc temperature isn't that high. Why?
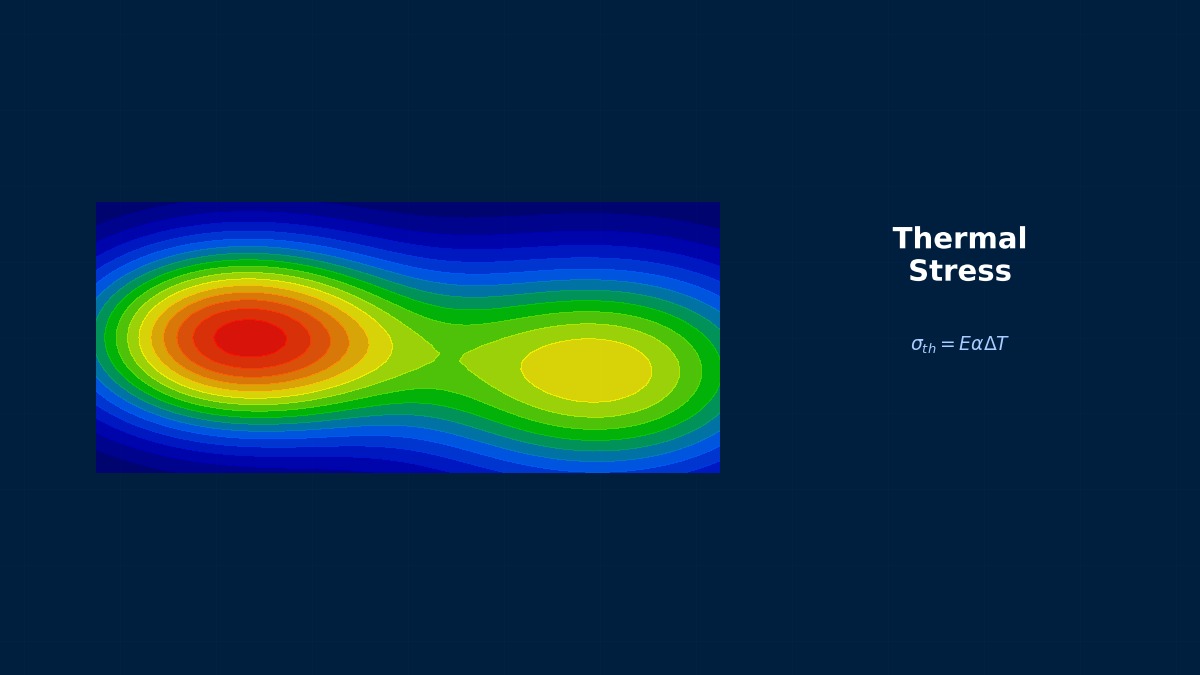
Average temperature and surface temperature are different things. Brake heat is generated at the pad–disc interface and mostly flows into the heat-absorbing disc. In a short, hard stop, heat piles up at the surface before it can spread inward, so the surface alone briefly gets much hotter. The hot surface tries to expand but is restrained by the cool interior, producing compressive stress, which turns tensile as it cools. Repeated cycles leave a network of surface cracks (heat checking).
Frictional heat generation
$\mu$ is the friction coefficient, $p$ contact pressure and $v$ sliding speed. Heat is generated at the contact and grows with speed and pressure.
Heat partition
$e$ is thermal effusivity, the ability to absorb heat through the surface. Assuming both surfaces share the same temperature, heat divides in proportion to effusivity. Metals are high, resins and ceramics low.
Surface temperature under short heating
While the heat penetration depth (about $\sqrt{\alpha t}$) is smaller than the body's thickness, the body can be treated as a semi-infinite solid. When heat flux varies with time, the effects of heating at each instant are superposed (Duhamel's integral).
Blok and the 'flash temperature'
Real contact between sliding surfaces occurs at tiny asperities covering a small fraction of the apparent area. In 1937 the Dutch engineer Blok showed theoretically that these contact spots briefly reach very high 'flash temperatures', explaining gear scuffing; Jaeger later developed the theory of moving heat sources. In brakes, gears, bearings and cutting, such local high temperatures hidden in averages are often where damage begins.
Worked example: a hard stop
Illustrative conditions: a 1,500 kg car stops from 100 km/h in 3 s at constant deceleration, with 70% of braking on the front axle. The disc is cast iron (8 kg, 0.0785 m² rubbing area); the pad is resin-based.
| Item | Value |
|---|---|
| Heat per disc | 203 kJ |
| Average braking power | 67.5 kW |
| Share into disc (effusivity ratio) | 90% |
| Whole-disc temperature rise | 50 K |
| Initial heat flux | 1.55 MW/m² |
| Peak surface rise (at 1.55 s) | 109 K |
| Surface rise at stop | 80 K |
| Penetration depth (3 s) | 6.7 mm |
The whole disc rises 50 K, yet the surface peaks near 110 K partway. Isn't the moment of stopping the hottest?
At constant deceleration heat generation is proportional to speed, falling to almost zero just before stopping, while heat at the surface keeps escaping inward — so surface temperature peaks partway, about 1.55 s here. Assuming constant average flux would predict 118 K at the stop, wrong in both time and size. Also, this assumes uniform heating over the rubbing ring; in reality contact concentrates, forming hot bands and hot spots where local temperatures are higher still.
How to approach the analysis
Thermo-mechanical coupling
- Obtain contact pressure from structural analysis and apply heat generation μpv.
- Partition heat by solving conduction in both bodies with matched interface temperature, or by the effusivity ratio.
- Thermal expansion changes contact pressure and hence heat distribution; solving this coupling predicts the growth of hot spots (thermoelastic instability).
- Assess heat-crack life from cyclic thermal stress.
“The disc goes wavy”
Repeated hard braking can leave the disc slightly varying in thickness around its circumference, causing periodic pedal vibration (judder). One cause is thermoelastic instability: a spot that contacts slightly harder gets hotter, expands and contacts harder still — a positive feedback that forms several hot spots around the disc. Microstructure or wear changes there, leaving thickness variation after cooling. Analyses that look only at average temperature can't see it; it emerges only from coupled contact and heat.
Common mistakes
Mistakes and fixes
| Mistake | Effect | Fix |
|---|---|---|
| Average temperature only | Surface cracking missed | Solve transient surface temperature |
| Splitting heat 50/50 | Disc temperature underestimated | Effusivity ratio |
| Constant average flux | Wrong peak time and value | Use the actual deceleration history |
| Uniform contact | Hot spots missed | Couple contact and heat |
| Ignoring repeated stops | Temperature accumulates | Analyse repeated-stop cycles |
I'd like to try friction and transient heat calculations myself.
Try the friction coefficient tool for friction coefficients, the friction clutch torque tool for clutch friction and the transient conduction simulator for transient conduction. Related topics are covered in semi-infinite solids, thermal stress, thermal shock and thermal fatigue.